2017年5月31日水曜日

[Python][CGI]SQLクエリーを実行した結果を表示する

test3.html
<!DOCTYPE HTML PUBLIC "-//IETF//DTD HTML//EN">
<html>
  <head>
    <META HTTP-EQUIV="Content-Type" CONTENT="text/html; CHARSET=UTF-8">
    <title>Ajax Test, SQL query</title>
    <script src="http://ajax.googleapis.com/ajax/libs/jquery/1.7.1/jquery.min.js"></script>
    <script type="text/javascript">
      $(function() {
        $('#sendButton').click(function(event) {
          $.post(
            "/cgi-bin/python_test/test3.py",
            { sendValue: $('#animal').val() },
            function(data, textStatus) {
              if (textStatus == 'success') {
                $('#textStatus').text('Success');
              }
              $("#result").html(data);
          }, 'html')
          .fail(function() {
              $("#result").html("Failed");
            }
          );
        });
      });
    </script>
  </head>
  <body>
    動物名<br/>
    <input type="text" name="animal" value="" id="animal"/><br/>
    <button type="button" id="sendButton">送信</button><br/><br/>
    textStatus: <span id="textStatus"></span><br/>
    Result: <span id="result"></span>
  </body>
</html>
test3.py
#!/usr/bin/python
#-*- coding:utf-8 -*-

import cgi
import psycopg2

# エラー発生時にレポートを表示
import cgitb
cgitb.enable()

html0 = """
<META HTTP-EQUIV="Content-Type" CONTENT="text/html; CHARSET=utf-8"/>
"""

#######################################################################
# DBに接続
#######################################################################
def connectDb():
 connection = psycopg2.connect("dbname=testdb user=username password=password")
 cur = connection.cursor()

 return connection, cur

#######################################################################
# DBから切断
#######################################################################
def disconnectDb(connection, cur):
 # commit
 connection.commit()

 cur.close()
 connection.close()

#######################################################################
# SQL query
#######################################################################
def select(cur, animal):
 sql = "SELECT id FROM animals WHERE name='" + animal + "';"
 print(sql + '<br/>')
 cur.execute(sql)
 result = cur.fetchone()
 if result == None:
  print(animal + ' is not found.<br/>')
 else:
  print(animal + "'s id is " + str(result[0]))

#######################################################################
# Main function
#######################################################################
if __name__ == '__main__':
 print(html0)
 form = cgi.FieldStorage()
 animal = form['sendValue'].value
 print('animal: ' + animal + '<br/>')

 # DBに接続する
 connection, cur = connectDb()

 # SQL query (SELECT)
 id = select(cur, facility)

 # DBから切断する
 disconnectDb(connection, cur)
実行結果(ブラウザに渡されるHTMLソース)
<html>
  <head>
    <meta http-equiv="Content-Type" content="text/html; CHARSET=UTF-8">
    <title>Ajax Test, SQL query</title>
    <script src="http://ajax.googleapis.com/ajax/libs/jquery/1.7.1/jquery.min.js"></script>
    <script type="text/javascript">
      $(function() {
        $('#sendButton').click(function(event) {
          $.post(
            "/cgi-bin/python_test/test3.py",
            { sendValue: $('#animal').val() },
            function(data, textStatus) {
              if (textStatus == 'success') {
                $('#textStatus').text('Success');
              }
              $("#result").html(data);
          }, 'html')
          .fail(function() {
              $("#result").html("Failed");
            }
          );
        });
      });
    </script>
  </head>
  <body>
    動物名<br>
    <input type="text" name="animal" value="" id="animal"><br>
    <button type="button" id="sendButton">送信</button><br><br>
    textStatus: <span id="textStatus">Success</span><br>
    Result: <span id="result">
      <meta http-equiv="Content-Type" content="text/html; CHARSET=utf-8">
      animal: dog<br>
      SELECT id FROM animals WHERE name='dog';<br>
      dog's id is 3
    </span>
  </body>
</html>

[Python][CGI]Ajax

id="sendButton"の送信ボタンを押した時に、test2.pyに対してname="a"のinput欄に入力したテキストをsendValueという変数に入れて渡す。 python2.pyから返ってきた文字列はid=resultのspan内に格納される。

test2.html
<!DOCTYPE HTML PUBLIC "-//IETF//DTD HTML//EN">
<html>
  <head>
    <META HTTP-EQUIV="Content-Type" CONTENT="text/html; CHARSET=UTF-8">
    <title>Ajax Test</title>
    <script src="http://ajax.googleapis.com/ajax/libs/jquery/1.7.1/jquery.min.js"></script>
    <script type="text/javascript">
      $(function() {
        $('#sendButton').click(function(event) {
          $.post(
            "/cgi-bin/python_test/test2.py",
            { sendValue: $('#a').val() },
            function(data, textStatus) {
              if (textStatus == 'success') {
                $('#textStatus').text('Success');
              }
              $("#result").html(data);
          }, 'html')
          .fail(function() {
              $("#result").html("Failed");
            }
          );
        });
      });
    </script>
  </head>
  <body>
    入力欄に文字列を入れると、POST されて応答が返ってきます<br/>
    <input type="text" name="a" value="" id="a"/><br/>
    <button type="button" id="sendButton">送信</button><br/><br/>
    textStatus: <span id="textStatus"></span><br/>
    Result: <span id="result"></span>
  </body>
</html>
test2.py
#!/usr/bin/python
#-*- coding:utf-8 -*-

import cgi

# エラー発生時にレポートを表示
import cgitb
cgitb.enable()

html0 = """
<META HTTP-EQUIV="Content-Type" CONTENT="text/html; CHARSET=utf-8"/>
"""

#######################################################################
# Main function
#######################################################################
if __name__ == '__main__':
 print(html0)
 form = cgi.FieldStorage()
 #print(form)
 value = form['sendValue'].value
 print('Hello, ' + value)
実行結果(ブラウザに渡されるHTMLソース)
<html>
  <head>
    <meta http-equiv="Content-Type" content="text/html; CHARSET=UTF-8">
    <title>Ajax Test</title>
    <script src="http://ajax.googleapis.com/ajax/libs/jquery/1.7.1/jquery.min.js"></script>
    <script type="text/javascript">
      $(function() {
        $('#sendButton').click(function(event) {
          $.post(
            "/cgi-bin/python_test/test2.py",
            { sendValue: $('#a').val() },
            function(data, textStatus) {
              if (textStatus == 'success') {
                $('#textStatus').text('Success');
              }
              $("#result").html(data);
          }, 'html')
          .fail(function() {
              $("#result").html("Failed");
            }
          );
        });
      });
    </script>
  </head>
  <body>
    入力欄に文字列を入れると、POST されて応答が返ってきます<br>
    <input type="text" name="a" value="" id="a"><br>
    <button type="button" id="sendButton">送信</button><br><br>
    textStatus: <span id="textStatus">Success</span><br>
    Result: <span id="result">
      <meta http-equiv="Content-Type" content="text/html; CHARSET=utf-8">
      Hello, abc
    </span>
  </body>
</html>

[Python][CGI]FORMからのPOSTデータ受け取り

test1.html
<html>
  <head>
    <meta http-equiv="Content-Type" content="text/html; charset=UTF-8">
  </head>
  <body>
  <form name="form" method="POST" action="/cgi-bin/python_test/test1.py">
    name: <input type="text" size="30" name="name"/><br/>
    mail: <input type="text" size="30" name="mail"/><br/>
    <input type="submit" value="submit" name="button"/>
  </form>
  </body>
</html>
上記のページで[Submit]ボタンを押すとtest1.pyが実行される。
test1.py
#!/usr/bin/python
#-*- coding:utf-8 -*-

import cgi

# エラー発生時にレポートを表示
import cgitb
cgitb.enable()

html0 = """
<META HTTP-EQUIV="Content-Type" CONTENT="text/html; CHARSET=utf-8"/>
<html>
<head>
<title>Test 1</title>
</head>
<body>
"""

html1 = """
</body>
</html>
"""

#######################################################################
# Main function
#######################################################################
if __name__ == '__main__':
 print(html0)
 form = cgi.FieldStorage()
 print('<b>name: </b>' + form['name'].value + '<br/>')
 print('<b>mail: </b>' + form['mail'].value + '<br/>')
 print(html1)
実行結果(ブラウザに渡されるHTMLソース)
<html>
  <head>
    <meta http-equiv="Content-Type" content="text/html; CHARSET=utf-8">
    <title>Test 1</title>
  </head>
  <body>
    <b>name: </b>aa<br>
    <b>mail: </b>bb<br>
  </body>
</html>

[Python][CGI]Hello, world

test0.py
#!/usr/bin/python
#-*- coding:utf-8 -*-

# エラー発生時にレポートを表示
import cgitb
cgitb.enable()

html = """
<META HTTP-EQUIV="Content-Type" CONTENT="text/html; CHARSET=utf-8"/>
<html>
<head>
<title>Test 0</title>
</head>
<body>
Hello, world<br/>
</body>
</html>
"""

#######################################################################
# Main function
#######################################################################
if __name__ == '__main__':
 print(html)
実行結果(ブラウザに渡されるHTMLソース)
<html>
  <head>
    <meta http-equiv="Content-Type" content="text/html; CHARSET=utf-8">
    <title>Test 0</title>
  </head>
  <body>
    Hello, world<br>
  </body>
</html>

2017年5月10日水曜日

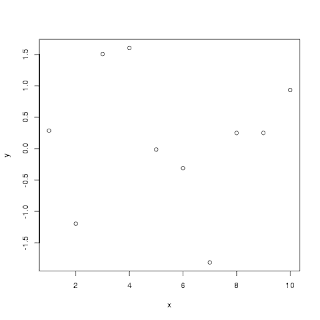
[R]plot グラフタイトル・軸ラベル

# 出力ファイル名
filename = "test1-"
file_no = 0

# 数値ベクトル同士のplot
x <- c(1:10)   # 1から10までの整数ベクトルを生成する
y <- rnorm(10) # rnorm(n): 正規分布に従う乱数をn個生成する
cat("x = ", x, "\n")
cat("y = ", y, "\n")

# 基本のplot
output = paste(filename, file_no, ".png", sep="") # 文字列間に空白が入るのでsep=""を指定して空白なしにする
file_no = file_no + 1
cat("output = ", output, "\n")
png(output)
plot(x, y)
dev.off()

# グラフタイトル
output = paste(filename, file_no, ".png", sep="") # 文字列間に空白が入るのでsep=""を指定して空白なしにする
file_no = file_no + 1
cat("output = ", output, "\n")
png(output)
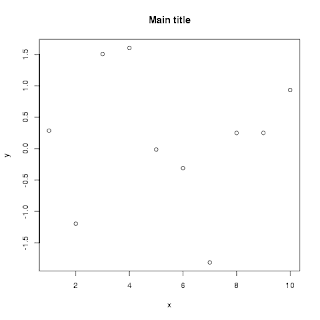
plot(x, y, main="Main title")
dev.off()

# X軸項目名
output = paste(filename, file_no, ".png", sep="") # 文字列間に空白が入るのでsep=""を指定して空白なしにする
file_no = file_no + 1
cat("output = ", output, "\n")
png(output)
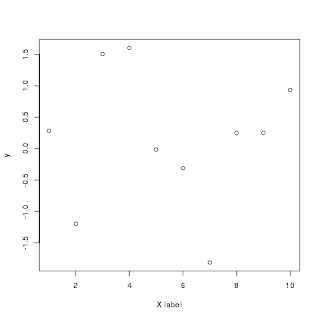
plot(x, y, xlab="X label")
dev.off()

# Y軸項目名
output = paste(filename, file_no, ".png", sep="") # 文字列間に空白が入るのでsep=""を指定して空白なしにする
file_no = file_no + 1
cat("output = ", output, "\n")
png(output)
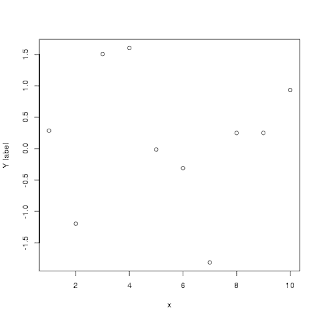
plot(x, y, ylab="Y label")
dev.off()
実行結果
$ Rscript test1.R
x =  1 2 3 4 5 6 7 8 9 10
y =  0.2868086 -1.195694 1.50674 1.604657 -0.01464439 -0.3106049 -1.813415 0.2500726 0.2512269 0.9339756 output =  test1-0.png null device
          1
output =  test1-1.png
null device
          1
output =  test1-2.png
null device
          1
output =  test1-3.png
null device
          1

test1-0.png

test1-1.png

test1-2.png

test1-3.png

[R]zoo

# zooパッケージを読み込む
library(zoo)

x <- read.zoo('test0.csv', sep=',', format="%Y-%m-%d %H:%M:%S", tz='Japan', col.names=c("datetime", "value"))
cat("x = \n")
print(x)

# Plot
png(filename='test0-plot.png')
plot(x)
dev.off()
実行結果
$ Rscript test0.R

Attaching package: ‘zoo’

The following objects are masked from ‘package:base’:

  as.Date, as.Date.numeric

x =
2017-04-28 00:00:03 2017-04-28 00:00:11 2017-04-28 00:00:14 2017-04-28 00:00:20
  -1.4862333 0.1039043 -1.4335332 -0.2203692
2017-04-28 00:00:37 2017-04-28 00:00:49 2017-04-28 00:00:57 2017-04-28 00:01:13
  -1.3775672 -0.8206941 1.0668013 -0.8139086
2017-04-28 00:01:31 2017-04-28 00:01:32
  -0.1771520 0.5120787
null device
  1
test0-plot.png

# zooパッケージを読み込む
library(zoo)

###############
# 日単位の時系列データを表示

# Date: 日付型
t = as.Date("2017-04-28") + c(1, 3, 7, 9, 14) - 1
cat("t = ", t, "\n")

v <- rnorm(5)
cat("v = ", v, "\n")

x <- zoo(v, t)
cat("x = \n")
print(x)

png('test1-plot.png')
plot(x)
dev.off()

#####################
# 秒単位の時系列データを表示

# 要素数
n <- 10

# rexp(n, rate): 指数分布に従うランダム数を生成する
# n: 生成する乱数の数
# rate: 比率のベクトル
r <- rexp(n, rate=0.1)
cat("r = ", r, "\n")

# cumsum(): ベクトルの累積和
t <- cumsum(r)
cat("t = ", t, "\n")

# rnorm(n): 正規分布に従う乱数をn個生成する
v <- rnorm(n)
cat("v = ", v, "\n")

# ベクトルtの各要素にPOSIXct("2017-04-28 00:00:00", tz="JST")を加える
cat("POSIXct(2017-04-28 00:00:00, tz=JST) = ", as.POSIXct("2017-04-28 00:00:00", tz="JST"), "\n")
t <- t + as.POSIXct("2017-04-28 00:00:00", tz="JST")
cat("t = ", t, "\n")

# zoo(value, time): zooオブジェクト(Z's ordered observations)を生成する
# value: 値のベクトル
# time: 時間のベクトル
x <- zoo(v, t)
cat("x = \n")
print(x)

# Plot
lim = as.POSIXct(c("2017-04-28 00:00:00", "2017-04-28 00:05:00"), tz="JST")
cat("lim = ", lim, "\n")

png(filename='test1-plot1.png')
plot(x, xlim=lim)
dev.off()
実行結果
$ Rscript test1.R

Attaching package: ‘zoo’

The following objects are masked from ‘package:base’:

  as.Date, as.Date.numeric

t = 17284 17286 17290 17292 17297
v = 0.87807 -0.1978724 2.154195 -1.168555 -0.7520462
x =
2017-04-28 2017-04-30 2017-05-04 2017-05-06 2017-05-11
 0.8780700 -0.1978724 2.1541946 -1.1685551 -0.7520462
null device
  1
r = 11.0301 18.67322 3.54064 14.88312 1.521852 0.3181695 13.12669 5.038134 27.43955 15.86685
t = 11.0301 29.70332 33.24396 48.12708 49.64893 49.9671 63.09379 68.13193 95.57147 111.4383
v = 1.069938 -0.1263455 -0.799708 -0.8663653 0.2562313 0.1949112 0.6599253 1.93077 -0.7650325 -1.813658
POSIXct(2017-04-28 00:00:00, tz=JST) = 1493337600
t = 1493337611 1493337630 1493337633 1493337648 1493337650 1493337650 1493337663 1493337668 1493337696 1493337711
x =
2017-04-28 00:00:11 2017-04-28 00:00:29 2017-04-28 00:00:33 2017-04-28 00:00:48
  1.0699382 -0.1263455 -0.7997080 -0.8663653
2017-04-28 00:00:49 2017-04-28 00:00:49 2017-04-28 00:01:03 2017-04-28 00:01:08
  0.2562313 0.1949112 0.6599253 1.9307703
2017-04-28 00:01:35 2017-04-28 00:01:51
  -0.7650325 -1.8136584
lim = 1493337600 1493337900
null device
test1-plot.png


test1-plot1.png

[R]irts

# tseriesパッケージを読み込む
library(tseries)

# 要素数
n <- 10

# rexp(n, rate): 指数分布に従うランダム数を生成する
# n: 生成する乱数の数
# rate: 比率のベクトル
r <- rexp(n, rate = 0.1)
cat("r = ", r, "\n")

# cumsum(): ベクトルの累積和
t <- cumsum(r)
cat("t = ", t, "\n")

# rnorm(n): 正規分布に従う乱数をn個生成する
v <- rnorm(n)
cat("v = ", v, "\n")

# ベクトルtの各要素にPOSIXct("2017-04-28 00:00:00", tz="JST")を加える
cat("POSIXct(2017-04-28 00:00:00, tz=Japan) = ", as.POSIXct("2017-04-28 00:00:00", tz="Japan"), "\n")
t <- t + as.POSIXct("2017-04-28 00:00:00", tz="Japan")
cat("t = ", t, "\n")

# irts(time, value): Irregular time-series objectを生成する
# time: 時間のベクトル, POSIXctクラスも使える
# value: 値のベクトル
x <- irts(t, v)
cat("x = \n")
print(x)

# plot
png('test0-plot.png')
plot(x)
dev.off()

# xの範囲を00:00:00から00:05:00に拡大
lim = as.POSIXct(c("2017-04-28 00:00:00", "2017-04-28 00:05:00"), tz="Japan")
cat("lim = ", lim, "\n")

png('test0-plot1.png')
plot(x, xlim=lim)
dev.off()

実行結果
$ Rscript test0.R
r = 19.13138 28.15198 7.95869 5.508244 5.016306 26.64211 3.880155 0.1472298 0.8519172 13.92242
t = 19.13138 47.28335 55.24204 60.75029 65.76659 92.4087 96.28885 96.43608 97.288 111.2104
v = 1.670187 0.5241287 0.1358097 0.4557246 0.2969836 -1.170975 -0.09803701 1.608483 -1.257771 0.7104526
POSIXct(2017-04-28 00:00:00, tz=Japan) = 1493305200
t = 1493305219 1493305247 1493305255 1493305261 1493305266 1493305292 1493305296 1493305296 1493305297 1493305311
x =
2017-04-27 15:00:19 GMT 1.67
2017-04-27 15:00:47 GMT 0.5241
2017-04-27 15:00:55 GMT 0.1358
2017-04-27 15:01:00 GMT 0.4557
2017-04-27 15:01:05 GMT 0.297
2017-04-27 15:01:32 GMT -1.171
2017-04-27 15:01:36 GMT -0.09804
2017-04-27 15:01:36 GMT 1.608
2017-04-27 15:01:37 GMT -1.258
2017-04-27 15:01:51 GMT 0.7105
null device
  1
lim = 1493305200 1493305500
null device
  1
test0-plot.png


test0-plot1.png

CSVファイルの読み書き
# tseriesパッケージを読み込む
library(tseries)

# 要素数
n <- 10

# rexp(n, rate): 指数分布に従うランダム数を生成する
# n: 生成する乱数の数
# rate: 比率のベクトル
r <- rexp(n, rate = 0.1)
cat("r = ", r, "\n")

# cumsum(): ベクトルの累積和
t <- cumsum(r)
cat("t = ", t, "\n")

# rnorm(n): 正規分布に従う乱数をn個生成する
v <- rnorm(n)
cat("v = ", v, "\n")

# ベクトルtの各要素にPOSIXct("2017-04-28 00:00:00", tz="JST")を加える
cat("POSIXct(2017-04-28 00:00:00, tz=Japan) = ", as.POSIXct("2017-04-28 00:00:00", tz="Japan"), "\n")
t <- t + as.POSIXct("2017-04-28 00:00:00", tz="Japan")
cat("t = ", t, "\n")

# irts(time, value): Irregular time-series objectを生成する
# time: 時間のベクトル, POSIXctクラスも使える
# value: 値のベクトル
x <- irts(t, v)
cat("x = \n")
print(x)

# データを書き出す
write.irts(x, file='test1.csv', sep=',')

# 書き出したcsvデータを読み込む
x1 <- read.table(file='test1.csv', sep=',', header=F, col.names=c("datetime", "value"))
x1$datetime <- as.POSIXct(x1$datetime, tz="GMT") # 文字列をPOSIXct形式に変換
print(x1$datetime)
print(x1$value)

x1 <- irts(x1$datetime, x1$value)
cat("x1 = \n")
print(x1)

# plotする
lim = as.POSIXct(c("2017-04-28 00:00:00", "2017-04-28 00:05:00"), tz="Japan")
cat("lim = ", lim, "\n")

png('test1-plot.png')
plot(x1, xlim=lim)
dev.off()
実行結果
$ Rscript test1.R
r = 0.7161429 1.793284 0.2478615 2.984724 12.45114 0.01925959 3.400675 7.554745 1.237016 0.7123535
t = 0.7161429 2.509427 2.757288 5.742012 18.19315 18.21241 21.61309 29.16783 30.40485 31.1172
v = 0.6099315 0.8728334 0.4375745 0.07694671 -0.0349662 -0.9421087 -0.1829869 -1.074823 0.8262679 2.159355
POSIXct(2017-04-28 00:00:00, tz=Japan) = 1493305200
t = 1493305201 1493305203 1493305203 1493305206 1493305218 1493305218 1493305222 1493305229 1493305230 1493305231
x =
2017-04-27 15:00:00 GMT 0.6099
2017-04-27 15:00:02 GMT 0.8728
2017-04-27 15:00:02 GMT 0.4376
2017-04-27 15:00:05 GMT 0.07695
2017-04-27 15:00:18 GMT -0.03497
2017-04-27 15:00:18 GMT -0.9421
2017-04-27 15:00:21 GMT -0.183
2017-04-27 15:00:29 GMT -1.075
2017-04-27 15:00:30 GMT 0.8263
2017-04-27 15:00:31 GMT 2.159
 [1] "2017-04-27 15:00:00 GMT" "2017-04-27 15:00:02 GMT"
 [3] "2017-04-27 15:00:02 GMT" "2017-04-27 15:00:05 GMT"
 [5] "2017-04-27 15:00:18 GMT" "2017-04-27 15:00:18 GMT"
 [7] "2017-04-27 15:00:21 GMT" "2017-04-27 15:00:29 GMT"
 [9] "2017-04-27 15:00:30 GMT" "2017-04-27 15:00:31 GMT"
 [1] 0.60990 0.87280 0.43760 0.07695 -0.03497 -0.94210 -0.18300 -1.07500
 [9] 0.82630 2.15900
x1 =
2017-04-27 15:00:00 GMT 0.6099
2017-04-27 15:00:02 GMT 0.8728
2017-04-27 15:00:02 GMT 0.4376
2017-04-27 15:00:05 GMT 0.07695
2017-04-27 15:00:18 GMT -0.03497
2017-04-27 15:00:18 GMT -0.9421
2017-04-27 15:00:21 GMT -0.183
2017-04-27 15:00:29 GMT -1.075
2017-04-27 15:00:30 GMT 0.8263
2017-04-27 15:00:31 GMT 2.159
lim = 1493305200 1493305500
null device
  1
test1-plot.png